Jackie Wang Personal Blog
- Jan 24, 2022
- 12 min read
Updated: Mar 29, 2022

Hi there! This is me, Jackie and her ten years old Sony camera👆
I'm currently a third year Environment track design student majoring in HCI and minoring in Intelligent Environment. My goal as a designer is to create interactions and experience that inspire people's curiosity and imagination.
Reflection | Week 1| 1/23
I found the reading Enchanted Objects very helpful as for understanding the role of designers and it resonates with me a lot. Starting from defining the future drives of human and then discussed how enchanted objects could fit people’s needs in circumstances, Rose provided a guide to the future design from a human-centered perspective instead of a technological one, which makes me feel more relieved and excited at the same time. The relief came from realizing that I don’t need to feel intimidated by the lack of deep understanding of all the latest, ever-changing technologies because they are not the core of design. The excitement came from knowing that there are endless unexploited design opportunities for designers to add enchantment. On the opposite, understanding where human needs could be fulfilled by technologies should be the starting point of designing enchanted objects. And this ties back to the question that Molly Wright mentioned in her talk-“Technology is the answer, but what was the question?” AI seems incredibly complex and mysterious, but Wright showed us that AI and machine learning came from age-old ideas that were meant to solve design problems, too.
After watching the two TED talks, my initial reaction was that people’s impression on AI and LoT is about to transform from a technical one to a humanistic one. Whereas the stereotypical vision for them used to be the blue, complex wave of micro-electronic chip and code, now they take forms in ordinary objects that evokes emotional and intuitive response from the users, which feels simple and understandable, despite how complex the system operate underneath the surface. The anatomy of AI reveals part of that complexity. It is hart to imagine how human could keep track of all the information synchronously, make accurate prediction, and respond timely.
Project 1
Research | Week 1| 1/24
In this project, we will be hypothetically using data gathered from MITES.IO , which allows us to gather the following types of data:


I started my research by documenting the space in TCS building and sorting the pictures into 5 general categories: Entertainment/Food & Drink Supplies, Casual common Space, Office/Studio, and Meeting rooms.
To visit my brainstorming process, please visit this Figma board.


The final three research questions that I landed on are:
How can we increase cross pollination through enabling perception of work/mental state (focus/relax/stressed) to others under consent?
How can we perceive the invisible threat of covid that leads to behavioral change?
When system makes automatic decisions that affects the environment, how to introduce these changes in an intuitive and delightful way?

Concept Sketches
Concept 1: Signaling system statues and decision making process

Each branch represents a type of input, and the node represents an action that system makes. For example, while the CO2 level goes up, the corresponding branch extend and when it reaches the threshold, the node lights up signaling that the fan is turned on.
In-class feedback:


Concept 2: Visualizing the invisible threat of covid

If sensor detects coughing, abnormal temperature, or simply movement suggesting people had occupied the area, then it would be registered as high risk (red). When a new user approaches the area, the projection gets activated to show the contaminated area.
In-class Feedback:

I decided to go with the first concept, but the I still need to future explore and refine my research question, physical form, and the ways my installation could interact with human.
Research
Predicting students' wellbeing from physiology, phone, mobility, and behavioral data
Predicting Bonding in Conversations
The history tablecloth: illuminating domestic activity
Reflection Week 2 | Jan 27
IoT Data in the Home
I found this paper very inspiring regards to the possible ways that people could interact with the data. The speculative sketches that arise from the study are also insightful. First of all, acknowledging data takes many forms changes the way we represent and make use of data. For example, the DR glasses reveals the locational aspect of data whereas the Data Dune model records the time aspect of data.
Another argument that caught my attention was how data are used to establish notions of truth and how the objective evidence might challenge the subjective evidence thus fail to empower and resonate with its users. The solution that the paper proposed is interesting too. By using a relative comparison of objective data, the device became more align with the subjective perception.
Podcasts
My main takeaway from the podcast is that data is not always hard truth because it can be screwed by the social and cultural context of data.
Case Study Inspiration I
The case study I chose is an reactive inflatable mask made by Jann Choy.
Liǎn (脸) is an experimental mask that explores the relationship between our online personas and offline self. It responds to one's real time online emotions.

The mask uses a form of artificial intelligence known as sentiment analysis to understand your online interactions. Depending on whether you choose to act positively or negatively, different corresponding areas of the mask swell, changing the structure of the mask.
Form Inspirations
One of the feedback from last class was "exploring more in the visual metaphor used could be interesting," so I started collecting form language that has modularity and flexibility. Some are more geometric whereas others are more organic. A concept that people brought up from the feedback was "anamorphosis". In biology terms, it means a gradual, ascending progression or change of form to a higher type. I see it as a progress that cannot go reverse, and it keeps the record of all the activities over time, which prompts me to reflect on whether my concept should be more reflective of the change over time or only the changes at the moment.

New Considerations

Forms of communicating data
Before diving into crafting a storyboard, I decided to explore the possible ways that IoT could indicate that change occurred.
Elevation, changing position in space
Stretch/Relax
Expand/Shrink
Dissolve/Unite
Leaving a path/ Predicting new path
Changing colors
There are definitely more ways! I will update the list when I come up with more.🧐

I mapped out different place in the TCS building on a 2D axis. The y-axis indicates the private-public level, and the x-axis suggests the social-productive level. Depending on the context, people's goals vary, which means that the information they want to access or manipulate also vary.

In the following list, I defined input as the result from the Synthetic sensors (door opened, people laughed...) rather than the raw sensor streams (humidity, light...), which involves recognizing patterns of sensor activation.
Top-right: Private office/study room
Input: user-defined input
Privacy: more personal information is presented
Function: more flexible
Output: only makes sense to the owner
Top-left: Studio/ Shared office
Input: collectively-defined input
Privacy: less personal, only neutral information will be shared
Function: more focus on social interactions and connection-building. Function might vary based on what the group needs.
Output: makes sense to everyone.
Bottom-Right: Common Space
Input: predefined input
Privacy: public
Function: more focus on subtle environment change. Serves to make the common space more delightful for everyone.
Output: makes sense to everyone.

In-class Feedback:


Week 3 | Jan 31
Concept 2

After watching the video below, I decided to include more active participation rather than situating the people in the observer role. I was also very inspired by the ways that data could be translated into physical materials.
Concept 3

The main idea is to show when data is being processed and giving the system a persona. I was thinking using AI writer to write a story of what the system thinks people are doing based on the second order data( door opened, lights on…) , but the story could be funny or weird.
I found this AI story generator online called DeepStory, and below is a sample of how the second order data could be translated into a story.

Case Study II
I actually run into this project after coming up with my second concept, but it was still interesting in seeing how other approach the topic of using data to intemperate human activities and giving machine a lifeforms that's magical and spiritual. However, I think BIT.HEAR takes on a more authoritative tone on judging the users whereas I'm trying the invite the user to peek into the system perspective and become more aware of the data being collected about them.
BIY.HEAR is a numerological processing project that acts like a prophet or a fortune teller. It interprets what the person said and calculates a destiny and a lucky number for this person. I admire how the creator enriches the meaning of technology and computation, which used to be purely pragmatic and mechanical. BIY.HEAR gives the user the illusion that it has some mysterious connection with supernatural power, which is a power conventionally unique to psychics.
BIY.HEAR was trained on Indian numerology and Astrology. The microphone on the board takes in words from a conversation and match the words with its symbolic meaning based on traditional Indian knowledge systems.
Personality
The three personalities I decided for my device is curious, passionate, and imaginative.
I started exploring how to show these traits through movement, color, and reactiveness.

Iteration 1

I roughly settled down on the interactions concept but still need to explore more about the form of the mini writer and his/her house. The goal is to make sure the form is coherent with function and the feeling of the experience, while showing affordance of how to interact with the device.


This is the corner I decided to work on because this is a spacious, chill, and popular space people like to work in. The device will be put against the wall and the screen will be sticked on the wall.

A digital model of my first prototype👉🏻
Week 3 | Feb 2
Reflections on Giorgia’s Lupi talk: Speak Data
Giorgia's talk was very enlightening in terms of reshaping people's relationship with data as well as the possible approach that I can adopt to get insights into problem space with data. I like how she phrased data as a filter to see different facet of people's life.Throughout her talk about the different projects she did, I saw there is a back and force of translating real life into numerical data and reverse.
It was also interesting to see how she craft a data set out of stories and achievement of women pioneers through categorization and mapping.
The juxtaposition between data-driven design and design-driven data is also worth further exploration.


Values
After listing to Isha’s talk, I feel that my concept has potential to fulfill the following values:
Comprehensible
Foresight
Appropriation


Feedback from Isha and the class:
Rethink the context of my device. How would the experience be different when it is somewhere visitors come and go v.s people who work and live in the building for a long time?
Form and location need some thinking.
Narrow down on the signal input, focus on one signal to reduce the complexity so that people could understand.
Iteration 2

One major feedback I received last time was about the context. I decided to choose this studio space on the second floor. Since one of my design's main features is to record stories over long period of time, it probably will be more meaningful for people who dwell the space instead of temporary visitors. It would become a dairy that is reflective of a group of people that they know and care about.

Feedback
Explain each value, not just name it. 3 might be too many. Take a photo of the space with people in it. Why not the entrance area? What type of data does it collect? what comes out of it? How do people know how to connect with it?
More Research on the Form

Concept 4: Mapping Movement into Imaginary World
When expanding the idea of storytelling, I thought about mapping those stories into the real world so that people can feel more connected to these fictional AI-written stories. It is also a way to organize stories so that people can better draw insights from the data presented.
According to this reading, Why is map important to story telling? "Maps govern the way we think about space, and that extends to imaginary or hypothetical spaces," and "the map is a device to orient the reader in an imagined world." Thus, I decided to explore this mapping idea a bit more in-depth.
Basic functionalities:
Location based story: tie data with location. In addition to phrasing real-world events into fictional stories, also generate fictional landscape base on the location of the real-world events.
Progressive disclosure: zoom into specific areas on the map to learn more about the story.

Styling of the Map


In terms of style, I looked into the ancient fantastical style, modern geometric(?) style, and hand-drawn illustration style.
Diagram 1

Diagram 2

The basic flow of my system is:
Users's movements get processed through two lens: time and location. (time as in how often movements occur). Base on these two factors, different landscape and buildings will appear on the map, which will gradually evolve into more advanced civilization.
Inspirations
➡️Evolving civilization on the map:

Start in the stone age and journey to future.
➡️Form of the map

Reactive topography + projection
➡️ User Interaction:

Maybe users can claim territory with physical IoT objects.
➡️ User Interaction:
The Augmented Reality Sandbox allows students and the public to interact with a miniature landscape, sculpting mountains, valleys, rivers and even volcanoes, with off the shelf readily available parts.
➡️ Technology/media for Output:
Instead of limiting the map to one screen, I could also map it into the room and encourage people to explore the landscape with this AR projector with ML system.
VR Projector
Or, to mimic a more hand-drawn style, I could use a router writing machine to draw on a huge sheet of paper. The performative aspect of it is also very engaging.

Router Writing Machine
Feb. 15
After reviewing the concept with Daniel, I realized that using location data might not be feasible, which means I need to give up the mapping idea 🙁. However, people still really like the AI story idea but wish I had explored the form and interaction more. Below are some comments that I found really helpful:


Things to consider in the next iteration:
General Questions:
What are the precedents informing your design?
How does your system make connection to the data being collected.
How would the users understand how to interact with your system?
Remember that the sensors collect data in space. Not about each occupant.
What is the value that you’re basing your concept on? Data awareness? Transparency? ….
How are you going to build your concept? Remember you have to show a full demo or partial demo+movie for your final deliverable.
Specific questions to my design:
How can I encourage users to contribute to the narrative?
How can I personalize the story to individual to increase interest and connection?
What are the ways people can interact with the story?
Feb. 22
After talking to Elizabeth, I started brainstorming ways to have the user contribute to the storytelling. One way of doing this is leaving blank space in-between the AI-written stories for user to fill out. This co-creation of story allows people to be part of the narrative and take some control over data output.
I also wish to let the stories take form of jigsaw puzzle pieces to go along the metaphor of being a part of a bigger picture in the room. Playing jigsaw also invites users to actively engage with the data.
Iteration 1-jigsaw pieces
On the front side, AI-generated stories will be printed on top of a colored background that suggests how dynamic the room is.

On the backside, time and raw data from mic, motion sensor, light sensor will be showed in a simplified manner.

Iteration1-jigsaw dispenser
The dispenser has 3 basic functions:

Show immediate reaction to new activities: visualization the formation a new jigsaw piece with projection on the wall.
Generate physical jigsaw pieces: Once done processing, the digital jigsaw piece will "slide down," be printed, and dropped into the box.
Save record of completed picture: show the current unfinished and the past completed picture.


The first iteration of the physical form mimics the conventional jigsaw box
Feedback:
Consider these:
What is the add-on value of showing people the story?
How to give them a sense of control over the story?
How to personalize data?
When would a piece be generated?
What to put on the screen? History seems to be an additional layer, not as important as the current state.
What is another way to play with the data that is not chronological?
Form consideration.
Feb. 24
Physical Prototyping
Working demo ⬆️
Arduino configuration ⬇️

Set up ⬇️


New diagram

Form Improvement Process

Once the concept was settled down, I started refining the form of my device to better contextualize the concept. When thinking of "collective", "aggregated", and "community", I naturally thought of beehive. The process of forming honey is, in a way, similar to how my data story is formed. By gathering pollen from a variety of flowers in the world, bees are able to form honey that other creatures can appreciate and make use of. Similarly, DataHive will also gather data that seems trivial, process them, interoperates them, and present them to the people in an intriguing way that they can relate to themselves.
I started with the model below, which is made of honeycomb with different hight and shades of orange. I think I might have taken the metaphor of honeycomb too far that became distracting, so I limited the use of orange only on some surfaces to draw attention to certain areas.
Then, I keep reducing the complexity of the form to make the overall form look less architectural and more like a standalone device that people can interact with rather than just looking at.


3D Fabrication
The 3d fabrication process has been a little frustration for me. I tried to plan every part out in the 3d model perfectly, but as I stared to up the stepper motor and the projector in the model, the "soft part" of each device like wires and cable couldn't fit in properly, which forced me to redo some of the 3d prints.


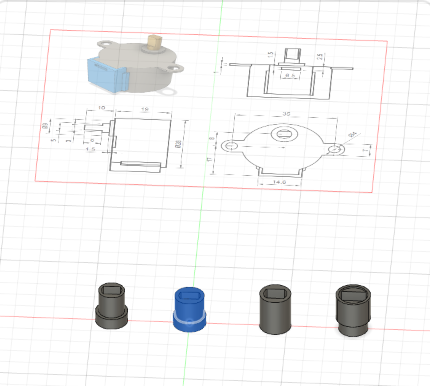


For example, I had a hard time connecting the dispenser wheel with the stepper motor perfectly to maximize the torque. I was not sure how much space I should leave between the stepper motor's tip and the hole in the dispenser because it involves considering the precision of the 3d printer.
One way I tried to mitigate this back and forth adjustment problem was to test out a bunch of mounting part with different dimensions, which would only take up about 30 minutes, and once I figure out which one works best, I would build the rest of the component on that mounting.
Story Mockup

Visuals:
I formatted the stories with bolded text as the event recognized by mites sensor and underlined blank space for people to filled out, and mapped out the corresponding data on the backside.


Animation
For the animation part, I initially only created one for the puzzle piece forming process: The 6 circles each represent a type of data that will also be showed on the back side of the physical puzzle pieces. The size and color of them change as the strength of each data type change in real world. Once it gathers enough data to form a different story compare to the previous one, the circles will start merging together and formalize the story that will be printed shortly.
After talking to Devika and Dina, I realized that it is important to include an interaction that makes the user feel being noticed and addressed. So, I changed my interaction from "automatically generate new story when received enough data" to " only generate story when requested by a user". This part of the interaction is conversational:
The concept video
Diagrams
Space Diagram

Device Interaction Diagram

Puzzle Piece Diagram


System Diagram

User Journey Map

Testing everything Together
Presentation


Comments