Eric Personal Blog
- Jan 25, 2022
- 14 min read
Updated: Mar 24, 2022

01-21 | Reflection and Project Kickoff
Molly Wright Steenson
I found Molly's examples of changing views on the ideal behavior of AI and machine learning interesting as something to explore further. She mentions how earlier figures in the AI world were more interested on getting unexpected results from their algorithms, while more modern researchers preferred predictability. I'm not sure if there's a "right" view between these two, but the unexpected nature of self-learning algorithms could be a worthwhile topic to explore in the context of our audience for this project.
Enchanted Objects and Anatomy of AI
David Rose and Kate Crawford / Vladan Joler seem to take opposite sides towards a future connected through AI and hackable consumption of everyday objects. Whereas Rose suggest the infinite possibilities related to boosting a person’s ability to consume and tap into this network, Crawford and Joler take a more cynical and realistic view and argue that the glory of accessible AI is driven by systems of exploitation and false realities driven still by humans.
_______________________
Storyboard of TCS mites.io Interaction

_______________________
Research Question #1:
What is the best way to present data collection, especially anonymized data such as that mites.io sensor hubs collect, in order to make people more comfortable with said data collection?
Research Question #2:
What are the advantages and disadvantages of presenting a smart environment as a black box versus complete transparency?
Case Studies (Not 100% relevant to my questions, but that I found interesting):
Mycroft AI: Open Source Voice Assistant with Opt-in Data Collection
Facebook Research App: Monetary Incentive, Data Invasive Evilness
01-25 | Finding a Focus
IoT Data in the Home
Reading about the methods these researchers used to understand how homeowners and residents interpret or are even conscious of the data being collected by their devices was inspiring, especially the follow up conceptual sketches and feedback that both parties collaborated on in the end.
In addition, attitudes about how data had been presented to them by their smart home systems raised an interesting point about the meaning of said data. As "Mikey" said, "I don't care that's you're going to show me a graph that shows like, oh look, I happened to be home three days this week", rather than an interpretation of why that data actually matters to them. IoT home device data as both a means of personal security and as a means of evidence was something I hadn't thought about: just having the knowledge that your own security camera was capturing activity and that you could replay it on a whim is a powerful feeling, even if an incident never occurred and you'd never have to look into the footage.
Data Materiality: Episode 4
We normally think of data as a separated entity from local and social histories and culture, but Yanni Loukissas makes a very strong argument that not only can it not be ignored, but should be actively considered in any type of research involving data collection. His dual background as both a designer and ethnographer gives him a unique perspective into dissecting the influence that culture plays into how data is formed, an example from the podcast being his explanation of how our idea of black culture being a separate and different entity than white culture (which in this context, was considered "mainstream" and therefore not as present within the data set). The podcast ultimately brought me back to the IoT research paper and the overall theme of utilizing data to create or tell stories that are relevant to those whom the data is sourced from or is being observed by.
Research Question:
Working together with Alison and Rachel, we narrowed down our scope into one question --
How does the ambient display of data or information heighten a user’s awareness of their behavior?
Other questions posed that we plan to incorporate include --
How can an environment respond to individuals and their actions within the space over both a short and long term period?
How can AI make people aware of their movements through a space? How can motion be translated into structure(s) that connects to people within a space (this short or long amount of time)?
In a shared work environment like TCS, how can AI aid people in their work or help create a more comfortable work environment? Either for easing stress or assisting in tasks.
How can AI and this data support people (students) studying and work? In what ways can it help track and manage time for individuals?
Those questions can be simplified into an overall theme of thinking about change over time (both in the short and long term) and making presence within a space known.
Case Study:
I decided to think back to my childhood and draw from a game I used to play with my friends - Club Penguin. It was a massively multiplayer online game that incorporated virtual spaces and emphasized group participation for many activities you could do on that virtual island. It was rumored that a giant iceberg on the map could flip with enough players standing on it. For many years this did not happen and was likely not coded in, but as the game was about to shut down, the iceberg did flip during a party event held there.

While this might seem like a bit of an irrelevant case, there's a lot to unpack here:
Active Participation: In order to tip the iceberg, a large amount of players had to be present on the island at one time. There could be several ways this could happen: communication on a third party forum or chat room, randomly stumbling upon a large group of players on your way to the iceberg for something else, or the in-game chat. Either way, this was a very intentional action that relied on everyone's willingness to participate.
Community Driven Stories: The tipping iceberg started out as just a rumor by players who had been to the iceberg before. With their ideas of how an iceberg might work in real life, they applied this to their idea of the virtual one in order for the tipping iceberg rumor to surface. Much like the IoT Data in the Home paper, data alone might be passive, but given the relevance of it to the people who use or look at it, stories could be created and player behaviors could change to fit those narratives (such as masses of players standing on the iceberg).
New storyboarding Ideas
Each of us created our own storyboards based on the most recent research questions chosen, and a common theme of nature and soft objects.

The below two-part storyboard was my idea. When a student first sits down at a table in TCS Hall, a previously neutral colored object lights up and depicts a growing plant within. As this user continues to use the table they are seated at, the plant will keep growing to reflect time spent. When the student finally leaves the desk for good, the "essence" of the plant they grew will flow into an empty arrangement of pots, natural objects and structures, through the use of wall mounted projectors to show the moving beams.
Over time, TCS hall would grow patches of green, vines and grass sprouting throughout the space through the use of blank physical objects with projector lighting to simulate each object. In other words, go from looking like the left into something like the right. This had the purpose of both showing a user how the space has been affected by their actions and to show others how the presence of others helps the space grow.


Looking at each other's storyboards, we realized that our overall concepts and themes were very similar, with only the visual presentation of the data (such as the subject of the desktop objects whether plants or orbs) differing between the three ideas. This was to be the focus during the next time we meet, so we can collectively brainstorm on a common idea narrowing down from our three.
2-01 | Early Prototyping
Designing the Behavior of Interactive Objects
The Personality Method that these researchers used to develop a couch robot experience made a great point in using human nature to guide the design process and make interactions or behaviors stronger. Personality is very much something we discuss with a human mindset, and even when we describe the personality of non-human things, whether animate or inanimate, we tend to use words developed to describe human behavior originally.
The reasoning behind developing Personality - a motion against HCI standards of efficient interactions first - seems like a natural way to gather feedback and uncover deeper reactions about an experience, past the usual questions asked about convenience, ease of use, whether one option was better than another, etc. When other people add meaning to a designed object’s behaviors and their interactions with it, there’s an opportunity to capitalize and use that meaning to make the experience more unique.
Audrey Desjardins — Data Imaginaries: Between Home, People and Technology
The Odd Interpreters project that Audrey Desjardins mentioned in her talk was a refreshing way to think about the presentation and engagement with data. The ways that each physical object depicted its collection of data was very different than the ways we currently take it in, such as visualizations including graphs, and offered a more nuanced way to think about data collection. For example, with the light recording fabric roll, objects that blocked sunlight in the environment, including plants and blinds, were recorded over time and add local factors into this recorded data, in addition to the routine habits of sunlight that the designer wanted to capture.
I loved the quote “imagining might be our best way to get closer to data”, as it sums up how we take data from being data and turn it into something interactive that builds on the data, rather than leaving the data as simply data.
Case Study: Pontus
Similar to our new direction featuring a plant as the medium through which data is being interpreted, Pontus was a project aimed at raising the status of a house plant from a mere decoration into something pet-like, imbued with a personality to build its relationship with its owner. We think of plants as more mysterious and less responsive than an animal pet, which moves, sounds, and behaves according to how you take care of it and interact with it. Pontus essentially uses the data a plant takes in (water, sunlight, etc), turning it into an output somewhat like Alexa or another virtual assistant, but with a more nuanced personality than that of the big tech giants’ voice assistants.
Although we will be dealing with the data mites collects about a space rather than focusing on the data intake from a plant, this project was very compelling to me in the sense that it gave personality to something we typically don’t think of as having one; this spirit is something we will need to consider when thinking about the little interactions a student in TCS might have with their plant.
Overall Direction

We narrowed our ideas down into one collective storyboard and concept. In this idea, there would be an interactive sculpture or model of a plant on each table in TCS Hall. When a student sits down at a table, the orb lights up and starts growing a plant inside. Once the user gets up, the plant gestures towards a wall of actual plants, upon which a QR code is printed that the student can scan. This would lead them into an AR app to visualize the plant they just grew, but in AR form, as well as other students' plants in the space that ultimately form into a garden.
Prototype / Exploration
For this week, I was curious about how the physical form of our plant / orb would look like. Though we were set on having a plant as the representation of data, the actual look and feel of it was still up in the air. With a tutorial, I created a potted succulent in Blender.

In addition to this version, I wondered what a representation of a succulent that could grow over time would look like, especially one that didn't involve parts of the plant mechanically moving (I thought that might come off as overly cheesy). My favorite was a succulent made of a frosted glass material that lit up in parts to show growth.


And a short animation to show the "growth":
02-03 | The Double Diamond
Speak Data:
Giorgia Lupi's talk about her work regarding data at Pentagram as well as her personal explorations was packed with unique examples about humanizing ways to view data and different applications of thinking about data than our preconceived notions of neutral values. I found Dear Data inspiring in the ways that very human elements, such as desires, weekly worries, and habits could be considered data, helping it seem more approachable, as well as Data Items, where Lupi crafts a data set from socio or historical impacts of articles of clothing, interesting in how it handled the creation of data in order to affect the visualization of it.
Feedback
Meeting with fellow student designers Isha and Devika, we gathered feedback about the overall gist of our idea, including how they perceived our idea in terms of interpreting data from the sensors in the hall.
From this critique, we came to the conclusion that user awareness of the environment was our main focus and the thing we would have to emphasize the most moving forward. We want students (our users) to be more aware of how their environment is collecting data about how they use the space, as well as be more physically aware of their environment by encouraging them to explore around it with AR elements overlaid in their phone screens.
Here are a group of ideas about the interaction that we came up with in a brainstorming session:


I storyboarded what a more abstract plant could look like, as well as how it would show that it was collecting different types of data and incorporate an AR element as well. This storyboard doesn't include the impact of others' presence in the AR element, but this plant would join a collection of others started by surrounding students, and be able to view characteristics / data of those plants.
02-10 + 02-15 | Finalizing the Idea
Revisiting Past Ideas
After presenting our broad explorations, none of them felt fleshed out enough or had enough potential for us to continue with them. Furthermore, the purpose of our interaction, which was to make visitors in the space more aware of the data being collected and to feel an attachment, rather than to nudge a behavior change, seemed to be lost every time we explained our idea.
In class, we explored a number of case studies and broke them down with a card-sorting activity, where we answered questions about interactivity, physicality, and overall impact in regards to our concept:

The activity helped us better understand certain aspects of our interaction and how best to explain it. We circled back to our original concept of a physical plant representation with an AR extension to learn more about the connection between the plant and the data collected by Mites sensors, starting with a clear explanation of our goals:
People's relationships with their environment grow over time through presence
By representing data through a natural environment, we want to develop a approachable, responsive mutual relationship between the user and the space
Instead of creating a behavior change, our goal is to increase people’s awareness through subtle responses in the environment, inviting users to learn more about the data being collected.


This three part storyboard was our visual guide to explain our concept, broken up to clearly show how the different experiences connected together during the entirety of a student's stay.
Guiding Feedback
Through revisiting and better communicating our idea, the feedback we received was much more constructive and aligned closer with our problem space. Dina loved the first and second part of our interaction, but raised concern about abstracting types of data into elements that help the plant grow, as it still wasn't clear that those objects were connected to mites or collected data.
Additionally, Dina suggested that we start prototyping the physical plant as well as the AR interaction, as things would start making more sense once we had rough prototypes up and running. We brainstormed ways that this physical plant could be made in real life:

Dina suggested a more literal connection between the physical plant and the mites sensor, so we sketched out an AR scenario where particles could stream from the mites to the plant, showing how data feeds the plant and causes it to grow.

We created a systems diagram to explain how different elements in our interaction mesh together to create a cohesive experience and to split our experience into distinctive portions:

We started prototyping the plant's physical form and how its petals could open:

This is a pushrod mechanism I mocked up that could be opened with an Arduino and servo motor:

And programming NFC tags for the first time (to be used to launch the user into an AR experience):

Mid-Progress Presentation + Feedback


After presenting this version of our idea, the main feedback we got was uncertainty on the purpose of using AR to show the connection between data and the physical form. It's worth noting that nobody had an issue with using AR, but just that we needed a justification for doing so. Additionally, the NFC or QR code to launch the experience was a clunky step in an otherwise seamless interaction; we needed to rethink that step.
02-22 | Major Pivot
With less than 2 weeks to finish our project, including a working physical form, AR experience, concept video, and polished presentation, we decided to rework the physical form and AR interaction in order to strengthen our idea and finish everything with high fidelity.
Physical Form Redirection:
Talking with our TA Elizabeth, she mentioned how our physical form, an Arduino blooming flower, had been done quite a few times with a similar form as what we were sketching:

Although we were planning to take heavy inspiration from these projects, she suggested that thinking about a more unique physical form could separate our concept from those projects and strengthen it as a whole. In response to that, we went back to pen and paper:

We settled on abstracting the plant with multiple flat petals / leaves lined up in a row, with an additional petal housing an AR experience in the front. By going with this direction, we could distance ourselves from previous projects.


Additionally, this form would be much easier to create a blooming mechanism for, as well as visually blend into the TCS Hall space it would be housed in, matching the use of flat wood construction and linear visual language.
AR Magnifying Glass
Our main issue with incorporating AR into our overall interaction was the jump between physical and digital interactions that had to be joined through the clunky use of an NFC or QR code.
We looked into different ways to present augmented reality outside of a traditional smartphone format:

The AR magnifying glass concept stood out to us the most: when prototyping our own version using a phone holder shaped like a magnifying glass, our experience using AR apps was greatly improved. Just the reframing of the phone into a more whimsical object helped separate it into a new experience. Additionally, having the entire ecosystem contained within the physical form meant that no code would be needed to launch an experience from a user's personal phone, but rather have the magnifying glass be constantly running the AR experience already.
Rapid AR Prototyping
Our original plan was to prototype AR in Unity, but due to the limited time constraint, we decided to switch to Adobe Aero. Since we wanted to have animated particles in Aero and there was no built in support, my teammate Alison animated the particles separately on Blender and imported the animation as a gif in Aero, creating a mockup that communicated our idea well given how little time we invested compared to an actual Unity prototype.

Branding and Visuals:


My teammate Rachel created posters, journey maps, and a branding language to convey the organic, whimsical nature of our concept.
Form Refinement and Physical Prototyping:

My focus became the physical prototype, since I had the most experience laser cutting, 3D printing, and working with Arduino. A couple of visual and working rough prototypes are shown below:


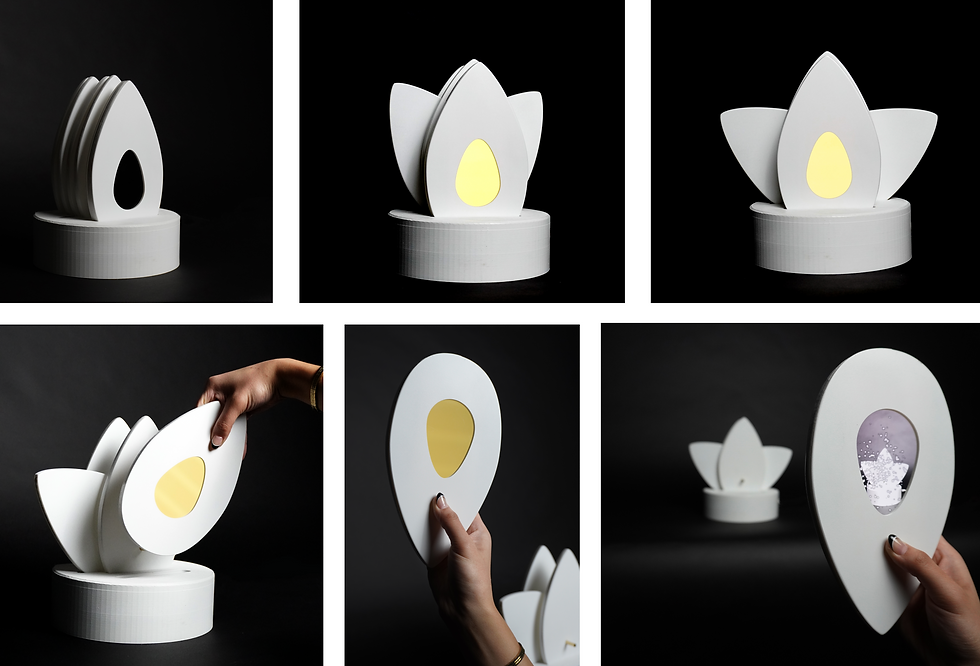
03-02 | Final Physical Prototype
Over the weekend and up to this Tuesday, we worked on creating the final physical prototype so we could shoot a concept video and take glamour shots in the photo studio by Thursday. Our final was made of laser-cut acrylic stacked together to form leaves and spray painted to look like one cohesive piece.


The base was 3D printed and also spray painted.

Here is the blooming mechanic working in action:
And a few glamour shots taken in a photo studio:
03-04 | Polishing Feedback
We went into Thursday's crit session with a 90% finished project, with the mindset to make minor tweaks to make our concept shine the week after Spring Break.
Elizabeth, Dina, and Devika's feedback is summed up like this:
There is currently no prompt for the user to pick up the magnifying petal once the plant has bloomed, nor is there a strong indication that the plant / mites sensor has sensed their presence when sitting down. Can the gradient animation be tweaked, and explore the motion of the plant, such as a small wiggle of acknowledgement?
The concept video needs more context. Perhaps a shot of Rachel walking into the TCS, a close-up of the mites, showing how time has passed, text to explain why the plant is blooming, etc.


03-15 | Final Tweaks
Per the feedback we received from last crit, we made a few improvements to our concept video to make the interaction journey more seamless and understandable from start to end:
Here were the points we decided to address:
Added an indication to pick up the petal
Decided against a wiggle when opening for consistency (already cracks open a bit)
Tweaked video to add explanations and more clearly explain AR interaction
With extra time, we would've love to integrate the base of this plant with the table, as well as think about more ways to show data being represented through the blooming plant rather than just a gradual opening movement (perhaps an animation on the frontmost petal?). However, we are very satisfied with the overall quality of our concept and feel that it is a great conversation starter about data collection transparency and helping visitors better connect with the mites.io sensors.


Comments